Key Features
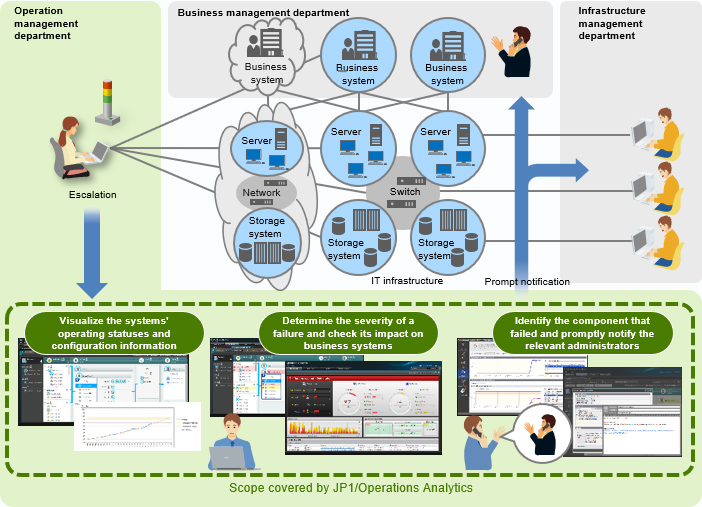
Improved visualization of the system’s operating status
and configuration information
You can monitor the IT infrastructure operating status, as well as the events that occur on the
servers and in the databases used by each business system on the dashboard. This allows you to
easily understand the configuration and relationships between the resources. You also can easily
create reports for the system’s operating status.


JP1/Operations Analytics displays information such as the impact of the failure on business systems and the causal relationships among problems that occurred in applications and resources. Presented in an easy-to-understand format, this information helps you identify the failure cause. Recovery methods suggestions and their possible side effects are also displayed, allowing you to decide the most appropriate way to resolve the failure.


